
चित्र:Sunil Gavaskar Graph.png

मूळ संचिका (९६३ × ४९२ पिक्सेल, संचिकेचा आकार: ८ कि.बा., MIME प्रकार: image/png)
Copied from en:Image:Sunil Gavaskar Graph.png. -- Sundar 04:49, 28 February 2006 (UTC)
सारांश
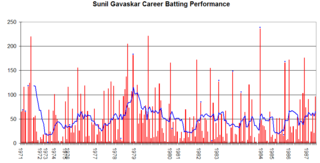
"This graph details the Test Match performance of Sunil Gavaskar. It was created by Raven4x4x. The red bars indicate the player's test match innings, while the blue line shows the average of the ten most recent innings at that point. Note that this average cannot be calculated for the first nine innings. The blue dots indicate innings in which Gavaskar finished not-out.
This graph was generated with Microsoft Excel 2002, using data from Cricinfo and Howstat.com.au."
परवाना:
| I, the copyright holder of this work, release this work into the public domain. This applies worldwide. असे करणे काही देशांमधे कायद्यानुसार शक्य नसू शकते. असे असल्यास : मी कोणालाही कोणत्याही कारणासाठी हे काम वापरण्याचे अधिकार कोणत्याही बंधनाशिवाय जर अशी बंधने कायद्याने बंधनकारक नसतीलतर देत आहोत. |
संचिकेचा इतिहास
संचिकेची त्यावेळची आवृत्ती बघण्यासाठी त्या दिनांक/वेळेवर टिचकी द्या.
| दिनांक/वेळ | छोटे चित्र | आकार | सदस्य | प्रतिक्रीया | |
|---|---|---|---|---|---|
| सद्य | १०:१८, २८ फेब्रुवारी २००६ | | ९६३ × ४९२ (८ कि.बा.) | Sundar | This graph details the Test Match performance of Sunil Gavaskar. It was created by Raven4x4x. The red bars indicate the player's test match innings, while the blue line shows the average of the t |
दुवे
खालील पाने या संचिकेला जोडली आहेत:
जागतिक संचिका उपयोग
संचिकाचे इतर विकिपीडियावरील वापरः
- en.wikipedia.org वरील उपयोग
- kn.wikipedia.org वरील उपयोग
- ta.wikipedia.org वरील उपयोग